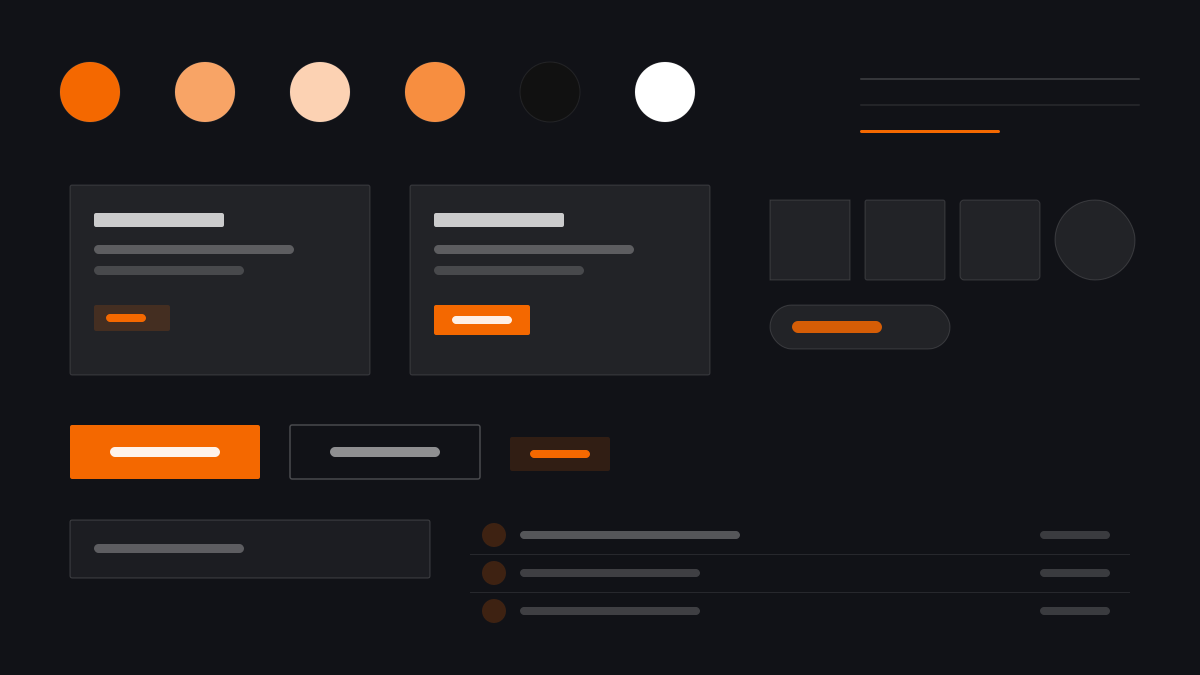
Grafana 的介面為長時間值守而生:近黑 #111217 畫布托起 #181B1F 面板,橙色 #F46800 只在告警與品牌位置上亮起,餘下全是灰階資料。細髮絲邊框、2px 圓角與高密度圖表把資訊量推到極限,同時保持掃描效率——監控、可觀測性與維運大螢幕的業界預設語言。
Grafana設計系統
提示詞範本
基礎範本
Design a Grafana-inspired observability dashboard. - Near-black #111217 canvas with #181B1F panels; - #F46800 orange reserved for alerts and brand highlights; - Hairline #2C3235 borders, 2px radii, dense grids; - High-density time series, gauges, and stat panels; - Dark ops console layouts. Colors: #F46800, #111217, #181B1F, #CCCCDC with #F46800 accent. Typography: Inter.
變體提示詞
📱 行動裝置
Design a mobile app with Grafana aesthetics. Use Grafana color identity with #F46800 accents. Clean, touch-friendly, native feel.
💻 Web 端
Design a web application with Grafana style. Use Grafana color identity with #F46800 accents. Professional, responsive layout.
📊 儀表板
Design a dashboard with Grafana design language. Use Grafana color identity with #F46800 accents. Data-rich, organized, clear hierarchy.
📄 到達頁
Design a landing page with Grafana visual identity. Use Grafana color identity with #F46800 accents. Compelling, conversion-focused.
使用範例
Grafana 監控牆
儀表板Create a monitoring wall with Grafana style: near-black canvas, #181B1F panels, orange #F46800 alert accents, and high-density time-series charts.
Grafana 日誌查詢介面
Web 端Design a log explorer with Grafana aesthetics: dark surfaces, hairline borders, monospace log lines, and orange highlights for errors.
✅ 適用情境
- 監控與告警大螢幕
- 可觀測性平台
- 維運與 SRE 主控台
❌ 不適用情境
- 面向大眾的消費級應用
- 需要柔和情緒的官網
DESIGN.md 檔案
符合 design.md 開放格式的設計系統描述,可複製或下載後交給 AI 程式設計工具使用。