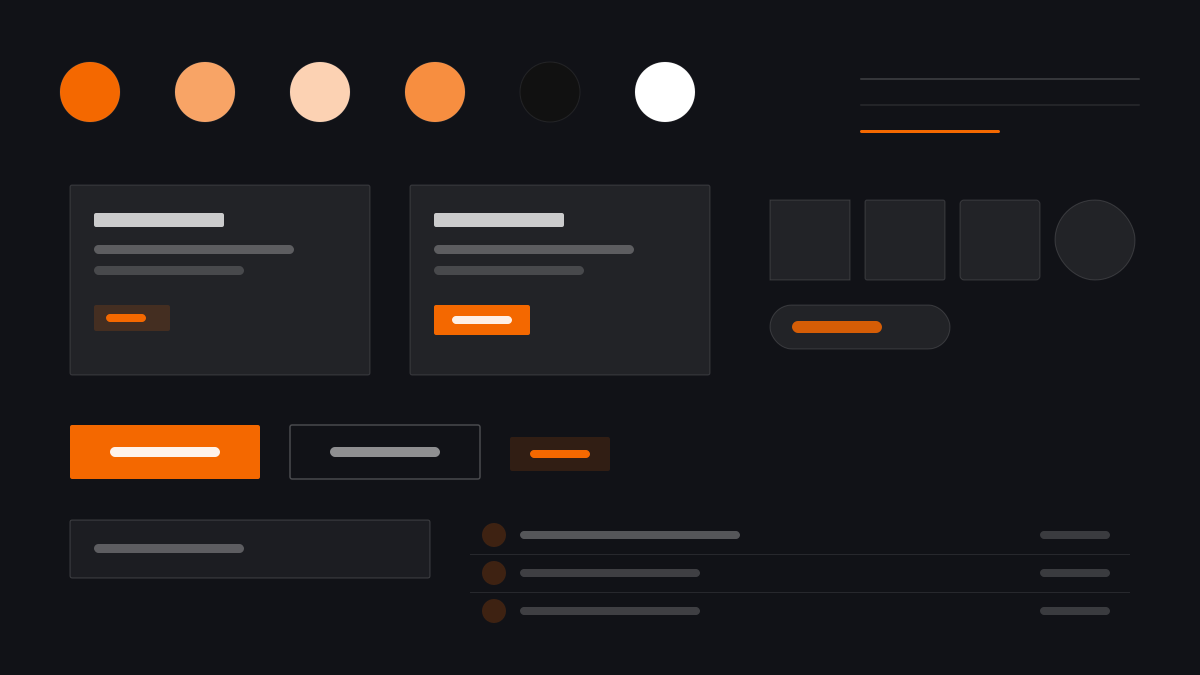
Grafana の UI は長時間のオンコール勤務のために生まれました。ほぼ黒の #111217 のキャンバスが #181B1F のパネルを支え、オレンジ #F46800 はアラートとブランドの位置でのみ灯り、あとはすべてグレースケールのデータです。細いヘアラインボーダー、2px の角丸、高密度のチャートが情報量を極限まで押し上げながら、走査効率を保ちます。監視、可観測性、運用ダッシュボードにおける業界のデフォルト言語です。
Grafanaデザインシステム
プロンプトテンプレート
基本テンプレート
Design a Grafana-inspired observability dashboard. - Near-black #111217 canvas with #181B1F panels; - #F46800 orange reserved for alerts and brand highlights; - Hairline #2C3235 borders, 2px radii, dense grids; - High-density time series, gauges, and stat panels; - Dark ops console layouts. Colors: #F46800, #111217, #181B1F, #CCCCDC with #F46800 accent. Typography: Inter.
バリエーションプロンプト
📱 モバイル
Design a mobile app with Grafana aesthetics. Use Grafana color identity with #F46800 accents. Clean, touch-friendly, native feel.
💻 Web
Design a web application with Grafana style. Use Grafana color identity with #F46800 accents. Professional, responsive layout.
📊 ダッシュボード
Design a dashboard with Grafana design language. Use Grafana color identity with #F46800 accents. Data-rich, organized, clear hierarchy.
📄 ランディングページ
Design a landing page with Grafana visual identity. Use Grafana color identity with #F46800 accents. Compelling, conversion-focused.
使用例
Grafana 監視ウォール
ダッシュボードCreate a monitoring wall with Grafana style: near-black canvas, #181B1F panels, orange #F46800 alert accents, and high-density time-series charts.
Grafana ログ照会画面
WebDesign a log explorer with Grafana aesthetics: dark surfaces, hairline borders, monospace log lines, and orange highlights for errors.
✅ 適した用途
- 監視・アラートの大画面
- 可観測性プラットフォーム
- 運用と SRE のコンソール
❌ 適さない用途
- 一般向けのコンシューマーアプリ
- 柔らかな情緒が求められる公式サイト
DESIGN.md ファイル
design.md オープン形式に準拠したデザインシステム記述。コピーまたはダウンロードして AI コーディングツールに渡せます。